Graphical hardware monitor

UUID: hwmonitor@sylfurd
Last edited:
4 months ago 2023-10-27, 14:52
Last commit: [6f45e451] Update hwmonitor@sylfurd (#5068)

Displaying realtime system information (CPU, memory, network and disk load).

README

Close

Graphical Hardware Monitor

Graphical Hardware Monitor is an applet that displays realtime system information (CPU load, memory usage, network in and out, disk usage (read and write)).

The code for this applet can be found under hwmonitor@sylfurd here : cinnamon-spices-applets

Issues can be reported here : Issues

Changes

Version 1.3.1:

  • **Bug Fix
    • Fixed a bug that crashed the applet if the hardcoded default was not a valid device option. The default is now the first device listed after scanning for devices on the system instead of "sda".

Version 1.3:

  • Bug Fixes and Feature Enhancements: Disk Usage Stats
    • Fixed a bug that prevented device mapper volumes (LVM, dm-crypt LUKS, etc.) from displaying usage statistics details or graphs.
    • Disk usage graphs and details statistics are now displayed as throughput with unit and graph scaling (B/s, KB/s, MB/s, etc.).
    • It is now possible to select the disk to monitor from a drop down menu in the settings UI that lists the available storage devices on the system.

Version 1.2.1:

  • New setting, a new minor UI setting, you can now choose how to draw the grid lines in the graphs. You can choose between:
    • Don't draw grid lines at all
    • Draw grid lines over the graphs (default)
    • Draw the graphs over the grid lines.

Version 1.2:

  • New graph, a graph that shows the battery charge level (BAT) for laptops have been added. Non-laptop users should turn off the graph in the settings if you want to save some space.

Version 1.1.1:

  • New setting for choosing what drive to monitor for DISK (read) and DISK (write).

Version 1.1:

  • Two new graphs, showing disk usage, are now available (called DISK (read) and DISK (write)). These graphs shows the usage of the root drive (/) (fixed in Version 1.1.1). It will automatically set itself up, based on the max usage over time. This means that the graph might show high usage in the beginning, but it will settle down once a reasonable max value has been set. These graphs are available in all versions of Cinnamon.

Version 1.0:

  • Multi-version support: Should now support older versions of Cinnamon (before 3.8).

Older versions (without a version number):

  • You can open the configuration dialog by right-clicking the applet and selecting Configure....
  • Configuration dialog has been cleaned up and divided into pages.
  • Some new themes have been implemented. (Thanks to @cgvirus)
  • There are two new graphs showing internet traffic in and out. Note that you might need to adjust the values for your Internet speed in the configuration dialog, both in and out, for the graphs to look good. The default value is 100 Mbit/s. You might want to set the values to slightly higher or lower than the internet speed you have paid for. You can show the graphs in a linear or logarithmic scale.
  • You can now turn on or off each individual graphs.
  • You can now choose the width (horizontal panels) or the height (vertical panels) of each individual graph.
  • You can now show or hide a detail label, which show for example CPU usage %, or used memory etc.
  • You can now control the font size of both the main label and the detail label.
  • Select the update frequency for the graph, by selecting the number of seconds between updates in the Update frequency combo.
  • Select theme : If you select dark theme, the graph will be drawn in dark colors and vice versa for light theme. If you select custom theme you can customize the colors so that they match your desktop theme perfectly.
  • You can set a custom label for each graph. By doing this you will override the labels from the language files.
  • You can now add more than one Graphical Hardware Monitor to your panels. Might be useful for people with more than one monitor.
  • The applet now works in both vertical and horizontal panels.

Requirements

Graphical Hardware Monitor requires the Gtop and GUdev packages to collect system information. It might already be installed on your system, but if the applet or graph is not shown, you might need to install the packages manually.

  • Debian/Ubuntu/Mint: install the packages gir1.2-gtop-2.0 and gir1.2-gudev-1.0
  • Fedora: install the package libgtop2-devel and libgudev
  • Arch/Manjaro: install the package libgtop and libgudev
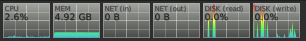
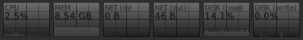
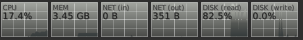
Example

Horizontal pane examples:

screenshot

screenshot

screenshot

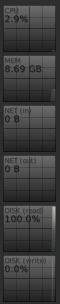
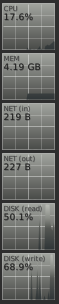
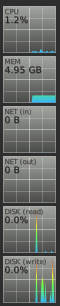
Vertical pane examples:

screenshotscreenshotscreenshot

Contributing

  • Sylfurd
  • Hultan (SoftTeam AB)
  • Claudiux
  • D1ceWard
  • kelebek333
  • Jason Hicks
  • spacy01
  • brownsr
  • Alan01
  • eson57
  • renepavlik
  • colinss
  • MrElectroNick
  • NikoKrause
  • giwhub
  • andreevlex
  • clefebvre
  • jacobwills

Log In To Comment!

59 Comments

Fahad Hasan Pathik
can we disable disk and bat data?
Fahad Hasan Pathik
Seems like configuration pages are not visible, only general setting is visible. Linux Mint 21 Cinnamon Cinnamon version 5.4.11
ktamp
ktamp-11 months ago
Unless all tabs fit inside the window, only the first one is displayed. Maximizing the window helps a lot.
emanuelpontesde
emanuelpontesde-1 year ago
Muito bom. Ficou compacto e é otimo o grafico no background. E funciona com painel la vertical.
Mario P. Cardenas
Mario P. Cardenas-2 years ago
I LOVE this applet. However, it seems to crash my Cinnamon desktop consistently every day. I don't wanna go to the more basic system monitor applet, please fix
Hultan (SoftTeam AB)
Are you sure it is this applet that are crashing Cinnamon? Can you file an issue, and maybe provide some logs, like ~/.xsession-errors or from journalctl, so that it can be investigated? See link to the issue page above.
Vlad Miller
Vlad Miller-2 years ago
Just noticed this applet, exactly the thing I was looking for, thank you. One question though. Would it be possible to add a fixed scale option to disk I/O graphs akin to the network speed option? Without it even tiniest 2 kB read/writes are making a graph spike into the red zone which looks kinda weird.
SekoiaTree
SekoiaTree-3 years ago
Crashes my cinnamon with the newest cinnamon update (not the only one, just reporting/checking if others are experiencing the same thing)
Rafid Aslam
Rafid Aslam-3 years ago
yes, it also crashes on mine after doing a system upgrade. (cinnamon 4.8.6, Fedora 33)
Max Nest
Max Nest-3 years ago
I have something strange happening with the network graph https://i.ibb.co/Hpc5B7H/image.png
Hultan (SoftTeam AB)
I think your net speed setting (configure/NET (in & out)/Internet speed (in & out)) might be too low compared to what your ISP can deliver. Try raising it a little... This is how it works, it compares the measured speed with your max speed setting to get a percentage. I know that at least my ISP are often delivering upwards of 125 MBit/s even though I only pay for 100 MBit/s. Hopefully we can make that automatic some day some how, but it just did not work well when I tried to get the internet speed automatically.
Lucas Fernando Nunes
How to insert a SWAP memory usage tab?
Jacob Wills
Jacob Wills-3 years ago
This statistic isn't available for monitoring with this tool at the moment, but thanks for the suggestion. I will add it to our list of feature requests and hopefully someone can get started on it soon. Swap can be handled in a few different ways so we will have to do some research to implement this correctly.
Daniel G
Daniel G-3 years ago
Unfortunately, the applet crashes (fail to load) on startup 8/10 of the times after the last applet update. Restarting Cinnamon with ctrl+alt+esc solves that and it works fine afterwards. Cinnamon 4.4.8-1 on Manjaro 20.
Hultan (SoftTeam AB)
Can you take a quick look at your ~/xsession-errors (at the time of the crash) and see if this is the same error as https://github.com/linuxmint/cinnamon-spices-applets/issues/3023? Otherwise, please report it as an issue here : https://github.com/linuxmint/cinnamon-spices-applets/issues Thanks...
Lloric Mayuga Garcia
Nice, give a star
Fraoch
Fraoch-3 years ago
I just updated this to 1.2.1. The BAT graph appeared which would be nice on a laptop but this is a desktop, so I'd like to turn it off. But the settings menu has reverted to something very simple? General Settings (update frequency, grid lines), Theme (graph) and Theme (graph data). I seem to have lost the more advanced controls turning on/off graphs and sizing them. I tried through right-clicking the graphs and selecting "Configure" and through Applets - Graphical hardware monitor - Configure and they're both the same.
Jacob Wills
Jacob Wills-3 years ago
If you are not seeing the tabs at the top of the settings window try resizing the window by clicking and dragging the corners of the settings window to make it larger. If your theme or font cause the tab elements to extend larger than the default window size the entire tab switcher is hidden.
Hultan (SoftTeam AB)
I just wanted to add that if you are using an old version of Cinnamon (before 3.8 I think) tabs in the configuration window was not supported. So then everything will be in sections on one page, hence a lot of scrolling will be required if that is the case.
Fraoch
Fraoch-3 years ago
Aha, if I maximize the configuration window I can see the tabs. When it comes up in its default size the tabs are not visible.
Jacob Wills
Jacob Wills-3 years ago
Glad that helped. I think we plan on reducing the number of tabs by consolidating some of the user interface elements in the future. That should make this less likely to be an issue regardless of font/theme used. Cheers!
Hultan (SoftTeam AB)
Are you saying that the BAT tab is gone in the configuration window? There should be a general tab + 7 more tabs, one for each graph.
Hultan (SoftTeam AB)
Thanks for all the positive feedback that has come in lately! I just added two new graphs in version 1.1, disk read and disk write, of the root disk (/). Hopefully you'll see that in a few days/weeks...
Fraoch
Fraoch-4 years ago
It's been a while since I updated this. Always liked it but the most recent update is a huge improvement! Definitely my go-to system monitor now.
thunderamur
thunderamur-4 years ago
The best system monitor applet for Cinnamon now! It must have more stars!
Fahad Hasan Pathik
Fahad Hasan Pathik-4 years ago
This excellent applet should have a gray theme for modern interface. Here is an example: https://github.com/linuxmint/cinnamon-spices-applets/issues/2620
saffrontsunami
saffrontsunami-4 years ago
This is a SUPERB app. ! I have used similar in a dozen Linuxes that I have used, but never been so impressed. From design to product, everything is so nice, I just HAD to tell all readers to disregard the negativity of the gloomy cautionary icons and notifications, this app is GOOD. It is easy to read, highly configurable, and very, very useful to optimize/troubleshoot your system. I went thru a heap of paranoid/schizophrenic/narcissistic "security" checks to sign up so I could comment. If this process was rationalized, there would be 400000 likes, not 4. Best Wishes & Regards !
claudiux
claudiux-4 years ago
What a good work! This applet is now a must have! I would add a Star if I could.
selionchik
selionchik-4 years ago
debian10+lightdm_cinnamon work exelent! Please, add netwok, I realy missing it and using different applet, but ghm is much better. Thanks to developpers!
Alberto Goldoni
Alberto Goldoni-4 years ago
in linux mint (19.1), after resume from suspension, the cpu graph remains flat
claudiux
claudiux-4 years ago
This issue is now fixed.
Karl Clinckspoor
Karl Clinckspoor-4 years ago
I had the same problem. You can restart Cinnamon with Alt+F2, typing "r" and hitting enter. Then the monitor will resume.
kluszon
kluszon-5 years ago
Linux Mint 19.1 x64 with Cinnamon "This applet contains function calls that could potentially cause Cinnamon to crash or freeze. If you are experiencing crashes or freezing, please try removing it."
BraianF
BraianF-5 years ago
To change the update frequency, edit file: ~/.local/share/cinnamon/applets/hwmonitor@sylfurd/applet.js, go to line "this.loopId = Mainloop.timeout_add(1000, Lang.bind(this, this.update));" and change the number to desired time (in milliseconds).
SoftTeam AB
SoftTeam AB-4 years ago
There is now a configuration window in this applet, where you can set update frequency easily.
rickrich
rickrich-5 years ago
Using it on Fedora 27, cinnamon-3.8.4. Quite nice. Only warning I get is in Add/Remove Applets: "This applet contains function calls that could potentially cause Cinnamon to crash or freeze. If you are experiencing crashes or freezing, please try removing it."
rickrich
rickrich-5 years ago
Oh, yeah. The warning is on "Graphical hardware monitor". All of the other ~13 installed applets don't have the warning.
SoftTeam AB
SoftTeam AB-4 years ago
@rickrich I have looked in to this, and from what I gather this is a warning that all applets get that uses calls to asynchronous javascript functions. My applet list currently has three applets with this warning sign. GHW probably gets the warning since it uses the Gtop package to receive memory and CPU information. If it actually happens (a crash or a freeze) because of this applet, please create an issue on GitHub.
©TriMoon™
©TriMoon™-5 years ago
Anyway to have it display info of the GPU also?
Hultan (SoftTeam AB)
hwmonitor@sylfurd uses libgtop to get information about the system. I have looked trough the documentation (https://developer.gnome.org/libgtop/stable/) and it doesn't provide information about the GPU (at least I have not found it). I have also looked through the code for other Applets that gives GPU information, and it looks like they always support ONE architecture (like NVidia or AMD), which makes me believe that it will be complicated to get information that will work for all graphic cards. But if anyone knows a (not too complicated) way to do this, please let me know...
Alex Apkhaidze
Alex Apkhaidze-6 years ago
To narrow down the applet, edit file: ~/.local/share/cinnamon/applets/hwmonitor@sylfurd/applet.js and change "const ScaleRatio" from 3 to 2. To apply changes, restart Cinnamon.
SoftTeam AB
SoftTeam AB-4 years ago
The applet now have a configuration window where you can set the width in pixels for horizontal panels, and height in pixels for vertical panels.
Dragoş
Dragoş-4 years ago
At least on certain themes, when hovering the graphs there's a hilite behind that doesn't quite look good (see here: https://postimg.cc/QFqhw9k9 ). If possible, please either disable hiliting on the applet or allow both width and height to be user-defined (with auto-centering according to panel position on screen). And one sort of feature request: would it be possible to add a numeric variant instead of the graphs, that could easily be toggled on/off through the context menu and/or a hotkey (like Ctrl+left click)? Something like [CPU: xx%][MEM: xx%]. When using the traditional mode, panel gets cluttered very fast with window buttons, and this applet takes a lot of space in graph mode. Thank you for all your work so far!
SoftTeam AB
SoftTeam AB-4 years ago
@Dragos I will look into that when I get some time over. Regarding text instead of graphs, that should be fairly easy to implement. Again, will look into that when I find some time. Meanwhile you can decrease the size of the graphs in the configuration window.
david-robson
david-robson-6 years ago
Only monitoring tool to work nicely with a vertical menu bar - I like mine on the right side of the screen! :-) To install the dependency, run the following without the quotes "sudo apt install gir1.2-gtop-2.0".
peter urquidez
peter urquidez-6 years ago
installed but have a Dependence missing message: install GTop package. Ubuntu / Mint: gir1.2-gtop-2.0. what is that and where do i find and install it?
Sergei Kovalev
Sergei Kovalev-6 years ago
Very useful. But i got error: in "System Monitor" actual CPU is 10% long time, but applet shows 100% long time and not decrease.
osmand
osmand-6 years ago
pls do one for network usage
SoftTeam AB
SoftTeam AB-4 years ago
@osmand Graphs for network usage is now implemented.
hub2git
hub2git-6 years ago
I have 2 requests: 1. Please let us adjust update frequency (as Jesse Boyd two weeks ago requested). 2. Please let us adjust the width. I want to narrow each graph to a fourth of the width.
SoftTeam AB
SoftTeam AB-4 years ago
Both those options now exists in the configuration window for the applet.
Peter Bittner
Peter Bittner-6 years ago
Very nice graphical applet!---I wish there were a desklet like this!
Nanners
Nanners-6 years ago
You fixed the "scaling" issue where it remained a static size and aligned to the top of the task bar in Cinnamon! Very nice.
Jesse Boyd
Jesse Boyd-6 years ago
how can I adjust the update frequency? I don't want to strain my system too much. Thank you!
Nanners
Nanners-6 years ago
Works fine in the Arch repo's Cinnamon. Pretty easy to customize if you can use a text editor and a little common sense. For instance, the font: (https://github.com/linuxmint/cinnamon-spices-applets/blob/master/hwmonitor@sylfurd/files/hwmonitor@sylfurd/applet.js) // Label cr.setFontSize(7); cr.setSourceRGBA(0, 0, 0, 0.5); cr.moveTo(2.5, 7.5); cr.showText(this.provider.getName()); cr.setSourceRGBA(1, 1, 1, 1); cr.moveTo(2, 7); cr.showText(this.provider.getName()); If you wanted a bigger, brighter label on each graph.
Fraoch
Fraoch-6 years ago
Works well, although it would be nice if I could make it a bit bigger. Does not scale if you resize the height of your panel.
Andreas Till
Andreas Till-6 years ago
After suspending my notebook the graph stays fairly high...
Nickolay Karnaukhov
I use it on all Mint machines I have!