Sensors Monitor

UUID: Sensors@claudiux
Last edited:
3 weeks ago 2023-05-08, 02:32
Last commit: [58c0ff6c] Fix lib/checkDependencies.js for applets using it (#4832)

Displays the values of many computer sensors concerning Temperatures (CPU - GPU - Power Supply), Fan Speed, Voltages, Intrusions. Notifies you with color changes when a value reaches or exceeds its limit.

README

Close

Sensors Monitor

Download

This applet displays and monitors the values ​​of many computer sensors concerning Temperatures (from CPU, GPU, Power Supply), Fan Speed, Voltages, Intrusions.

It notifies you with color changes when a value reaches or exceeds its limit.

It uses values from the sensors command. (See lm-sensors.)

Any suggestion to improve this Sensors@claudiux applet is welcome.

Benefits

  • Allows simultaneous display and monitoring of values ​​from multiple sensors, including sensors of the same type. (For example: 2 temperatures, 3 voltages, 1 fan speed, 1 intrusion detector can be displayed in the panel.) The number of values displayed in the panel depends only on the size that you can or want to allow to this applet.

  • This applet's tooltip can display sensor values ​​and limits, including those that are not displayed in the panel. The number of sensors you can display in the tooltip depends only on the height of your desktop.

  • All values are displayed in your local format.

  • Many display options are present in the settings.

  • The menu of this applet gives you direct access to the different kinds of settings, and contains useful shortcuts.

  • Avoid wasted processor time and memory leaks.

Dependencies

This applet needs three packages:

  • lm-sensors to get the sensor values.
  • xsensors to display these values in an independent graphical interface.
  • fonts-symbola that contains some symbols used by this applet.

Sensors@claudiux helps you to install these packages, if any.

Install

From Cinnamon Settings (recommended)

Just go to System Settings > Applets then

  1. In the just opened window, in Download tab, search this applet with the keyword Sensors and download it.
  2. Go to the Manage tab of the same window, click on this applet then add it to Cinnamon.
  3. Open the settings of this applet and configure it as you want.

From the Cinnamon Spices website

Download the package containing the latest version of this applet and extract the contents into ~/.local/share/cinnamon/applets. Then go to System Settings > Applets and run the 2-3 steps above.
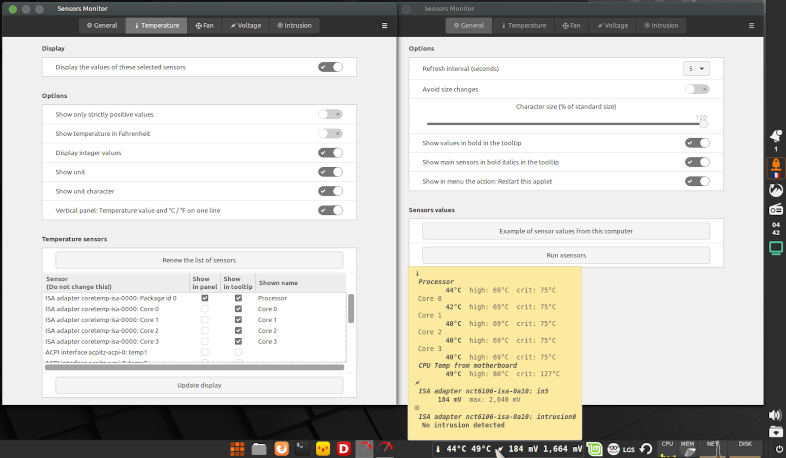
Settings

There are five tabs in settings:

  • General
  • Temperature
  • Fan
  • Voltage
  • Intrusion

All these tabs are directly accessible from the menu of this applet.

FAQ

How to display the temperature of each of my disks?

Internal disks

Try to load the drivetemp module:

sudo modprobe drivetemp

If that give you a valid result running sensors, add drivetemp into the list of modules to load at startup of your computer:

echo "drivetemp" | sudo tee -a /etc/modules

External disks (on USB port)

First, run the command:

echo "%sudo ALL = NOPASSWD: /usr/sbin/smartctl" | sudo tee /etc/sudoers.d/smartctl

Then log out and log in your session.

My PC has several temperature sensors and their values ​​are different. Why and which one to choose?

Example:

  • CPUTIN = CPU Temperature Index
  • AUXTIN = Auxiliary Temperature Index
  • SYSTIN = System Temperature Index

AUXTIN is the Power Supply temperature sensor (if there is one) while SYSTIN relates to Motherboard.

CPUTIN and CoreTemp are different. The temperatures they indicate are not from the same sensor. CoreTemp is the sensor on the processor while CPUTIN is the motherboard CPU temp sensor.

Coretemp gives the real temperature of each processor core (Core 0, Core 1, ...) and the real global temperature of the processor in Package.

There is a part of the sensors command output:

Package id 0:  +44.0°C  (high = +69.0°C, crit = +75.0°C)
Core 0:        +43.0°C  (high = +69.0°C, crit = +75.0°C)
Core 1:        +42.0°C  (high = +69.0°C, crit = +75.0°C)
Core 2:        +40.0°C  (high = +69.0°C, crit = +75.0°C)
Core 3:        +40.0°C  (high = +69.0°C, crit = +75.0°C)
[...]
CPUTIN:         +49.0°C  (high = +80.0°C, hyst = +75.0°C)
                         (crit low = +127.0°C, crit = +127.0°C)

The CPUTIN value can be "polluted" by the temperature of the motherboard (SYSTIN).

So, in this case, choose the Package id 0 value to display the temperature of the CPU.

In settings, no sensor appears in certain tabs.

There are different reasons:

  1. The kernel modules driving these sensors are not started. Beware of too recent hardware / motherboard.
  2. The module is successfully started but it returns a zero value and you have checked the Show only strictly positive values box. Example: Your computer is fanless, so no fan is present to send data to the fan sensor.
  3. Your sensor is wrong or not connected.
  4. Your /etc/sensors3.conf file (or any .conf file in /etc/sensors.d) must be configured for your chip. Search if a configuration file already exists. Once config file is installed, reboot the computer.

Some values seem to be wrong

Your /etc/sensors3.conf file must be configured for your chip. Search if a configuration file already exists.

Since version 3.0.0 of this applet, you can specify certain limit values and a formula to correct the values returned by a sensor. This is often much simpler than having to modify the /etc/sensors3.conf file. The correct values and the formula will be found in the documentation of your chipset.

My computer seems to have very few sensors

Try the sensors-detect command with root rights (sudo sensors-detect). See man sensors-detect for more information.

If you have specific hardware, try to put into the /etc/sensors.d/ folder (with root rights) at least one of these .conf files.

How to report an issue or make a feature request?

  1. Click on the "Issues" button at the top of this page and open a "New issue".
  2. Start the title with: Sensors@claudiux: . This title must contain a very short description of the issue (or feature request).
  3. Mention me in the text: @claudiux.
  4. Indicate the version numbers of Cinnamon (command: cinnamon --version in a terminal), of sensors (command: sensors -v in a terminal) and of this applet (visible by opening its menu).
  5. Open the General tab of settings of this applet, click on the button "Example of sensor values from this computer", copy all the content of the just opened window and paste it between two triple-backquotes in the text of the issue.
  6. Open a terminal and execute the command: sensors -j. (If it does not work, try sensors -u.) Copy/paste the output in the text of the issue, also between triple-backquotes.
  7. Describe your problem in as much detail as possible. Thank you.

Since I installed this applet, my ~/.xsession-errors file is flooded by 'posix_spawn' messages

These messages are simple warnings and appear or not depending on the version of GLib used by the Linux distribution. Thus, they appear in Linux Mint 20, but not in Linux Mint 19.3.

To avoid this file flooding, please install the Sanitize ~/.xsession-errors Cinnamon extension.

Contributing

Any contribution or translation is welcome!

Available translations and their authors

Translation Code Author (Github account)
Czech cs Bohuslav Kotál (@Fotobob1)
Danish da Alan Mortensen (@Alan01)
Dutch nl Jurien (@French77)
French fr claudiux (@claudiux)
Spanish es claudiux (@claudiux)
Turkish tr Serkan Önder (@serkan-maker)

Thank you very much to all of these translators!

Thank the author

If you think this Cinnamon applet is useful, then please take the time to log in with your Github account and click on the star at the top of this page. It really encourages me!

Claudiux (@claudiux)

CHANGELOG

Open

Log In To Comment!

34 Comments

claudiux
claudiux-1 month ago
Version 3.0.0 of this Sensors Monitor applet is here! You can now define formulas and limit values for each sensor, if necessary. Enjoy it!
Alex Spurling
Alex Spurling-4 months ago
I have just installed Sensors 2.0.2 but I do not see any entries in the Temperature sensors list. Also, I do not see any button called "Renew the list of sensors" here which I can see in the screenshot at the top of this page. Is this because I have missed a step in the configuration or is it a problem with my system?
claudiux
claudiux-4 months ago
Please try with command: sensors Then, open an issue using the 'Issues' button at the top of this page. This is best suited for technical discussions.
Alex Spurling
Alex Spurling-4 months ago
Thanks, I have asked the same question in github.
claudiux
claudiux-4 months ago
Thank you! You've closed this issue. For all users: all you had to do was check the 'Display the values of these selected sensors' box in the Temperatures tab, then press the 'Renew the list of sensors' button twice, just long enough for the program to ' sensors' returns the first data... Regards. Claudiux
claudiux
claudiux-4 months ago
Sensors v2.0.2 is here! The bug reported by Pedro Nuno Santos is now fixed. Enjoy it!
elmarvotri
elmarvotri-4 months ago
Cinnamon 21.1 here and runs smoothly. I have one issue, icon only for Temperature Sensors, the others I get a blank square. Maybe my miss configuration, but cannot solve this with my actual level of expertise on Linux.
claudiux
claudiux-4 months ago
Are the Symbola fonts installed? For Linux Mint, Ubuntu or Debian: `sudo apt-get install fonts-symbola` For Fedora: `sudo dnf install gdouros-symbola-fonts` On Arch: `~/.local/share/cinnamon/applets/Sensors@claudiux/scripts/install_symbola_on_Arch.sh` Then, reload this applet or restart Cinnamon.
Pedro Nuno Santos
Pedro Nuno Santos-5 months ago
Hello I think 2.0.1 has a "regression" - I have my fan RPMs showing on the tooltip only (and temp on panel + tooltip) and the "|" divisor is being added to the panel even though there's only a single temp value being displayed. If I disable the fan the divisor on the panel goes away but so will the tooltip value. I'm on 21.0 (haven't yet updated to 21.1)
claudiux
claudiux-5 months ago
Hello Pedro, I see. I'll try to fix this issue soon. Thanks for your message.
claudiux
claudiux-4 months ago
Issue fixed! Please wait for update.
claudiux
claudiux-4 months ago
It's been at least 3 weeks since the Cinnamon team no longer validated any PR. In the meantime, here is the link to the new applet.js file: https://github.com/linuxmint/cinnamon-spices-applets/blob/4e98d5a6f84707a6811efded52b062052a533ba2/Sensors%40claudiux/files/Sensors%40claudiux/applet.js
claudiux
claudiux-5 months ago
Sensors v2.0.1 is coming. Please wait for update.
iznobe
iznobe-6 months ago
Bonjour claudius et bon weekend . * pour : 'sudo sensors-detect' et répondre 'y' à toutes les questions ; puis re-démarrer l'ordi. je l' avais deja fait plusieurs fois , sans changement notable . * pour : Pour les températures de disques durs internes (pas via port USB) : 'sudo modprobe drivetemp'. Si ça fonctionne, ajouter la ligne 'drivetemp' à la fin du fichier /etc/modules. c' est fait , mais je ne sais pas si cela a fonctionné ou pas car le retour de la commande etait vide , aucune erreur , donc je dirais que ca a fonctionné . j ' ai donc passé ensuite : 'echo drivetemp | sudo tee -a /etc/modules' pour finir , j' ai passé : 'sudo /etc/init.d/kmod start' et redemarrer . maintenant , j' ai donc fait un screen vite fait : https://zupimages.net/up/22/48/c38j.png ca a donc bien fonctionné pour les disques internes . je trouve que c ' est compliqué pour s ' y retrouver , je ne sais pas quel capteur correspond a quel disque : 'iznobe@iznobe-PC:~$ lsblk -fe7 -o+model NAME FSTYPE FSVER LABEL UUID FSAVAIL FSUSE% MOUNTPOINTS MODEL sda ST4000VX000-2AG166 ├─sda1 ext4 1.0 Seagate_4T 4f8cc284-cd84-4eeb-b412-7539f81664c4 └─sda4 ext3 1.0 ubuntu_22.10 89f71135-b459-4c74-bfa3-e9d27df4369d sdb WDC WD82PURZ-85TEUY0 ├─sdb1 ext4 1.0 WD8 1db8a5b3-ff12-4d31-9463-b188ffefe43b 1,2T 82% /mnt/DATAS/Vidéos/WD8 └─sdb2 ext4 1.0 SAUV d9dc9f4e-a24a-4573-9465-13711480f272 sdc TOSHIBA HDWD130 ├─sdc3 ext4 1.0 datas 01c9b796-0869-4ff9-a2a1-6c0f56ed5257 2T 26% /datas └─sdc4 swap 1 61218fe2-0bd1-4ada-9dd3-5ec996a02456 [SWAP] sdd WDC WD8001PURP-85B6RY0 └─sdd1 ext4 1.0 WD8PRO1 6298e7b7-7e63-4f5c-8216-ab1f70a1876d 6,6T 9% /media/WD8PRO1 sde WDC WD8001PURP-85B6RY0 └─sde1 ext4 1.0 WD8PRO2 084604bc-1b9e-4cdd-bae4-ac9a9fe1303f 6,9T 4% /mnt/DATAS/Vidéos/WD8PRO2 zram0 [SWAP] nvme0n1 ADATA SX8200PNP ├─nvme0n1p1 ntfs windows_10 08CCB0D8CCB0C0EC ├─nvme0n1p2 ntfs E49A115A9A112B16 ├─nvme0n1p3 vfat FAT32 SSD_EFI_WIN C071-9050 59,6M 38% /boot/efi ├─nvme0n1p4 ntfs 0E52DDB352DD9FAF ├─nvme0n1p5 ext4 1.0 LM_21_SSD eb18366b-2ac9-4a7e-8f93-ba2caa30e90e 5,8G 76% / ├─nvme0n1p6 ext4 1.0 ubuntu_18_SSD 06bc0f51-50e8-4ed4-8090-903acdb7df3f ├─nvme0n1p7 ext4 1.0 budgie_SSD 8ab22881-60b3-47aa-a0bf-54c292afae81 ├─nvme0n1p8 ext4 1.0 ubuntu_20.04_SSD dca54497-1ab2-4c12-bc82-53b817300288 └─nvme0n1p9 ext4 1.0 LM_SSD_NEW df3cd676-80e7-46ef-a28e-5dbe3ea5ddf7 iznobe@iznobe-PC:~$'
iznobe
iznobe-6 months ago
Salut claudiux , je viens de voir que l' on est voisin :D ca fait longtemps que j' utilise l ' applet precedent et maintenant celui-ci , sauf que je n ' arrive pas a afficher les vitesses de ventilateurs et les tensions sur le nouvel applet . J ' ai bien lu que ca pouvait venir de plusieurs choses , comme le noyau ou d' autres choses . Je me demandais juste comment investiguer pour en avoir le coeur net avec ce qui cloche sur mon sintallation et savoir si il y a moyen de corriger ou si il est impossible d ' avoir plus d' infos a ce sujet . Merci pour cet excellent travail en tout cas , c ' est toujours utile de monitorer son ordi . Bonne soirée et au plaisir .
claudiux
claudiux-6 months ago
Salut voisin :) Pour les tensions et les vitesses de ventilateurs, il faut tenter un : 'sudo sensors-detect' et répondre 'y' à toutes les questions ; puis re-démarrer l'ordi. Pour les températures de disques durs internes (pas via port USB) : 'sudo modprobe drivetemp'. Si ça fonctionne, ajouter la ligne 'drivetemp' à la fin du fichier /etc/modules. Pour les températures de disques durs internes comme externes (via port USB) : 'echo "%sudo ALL = NOPASSWD: /usr/sbin/smartctl" | sudo tee /etc/sudoers.d/smartctl' Ensuite quitter sa session puis la rejoindre.
rdlf4
rdlf4-1 year ago
One thing that I noticed is the background colors that will switch from red to orange. Only problem is, on Linux Mint 20.1 with the officially supported Linux Kernel v 5.4.0-90, Sensors will show up in red when my temperature is in the upper 40s up to the lower 60s and then in yellow for anything above that. After switching to another kernel (Xanmod), this applet behaves as it should: no background color for temps in the lower 50s and then it changes the color for upper 60s or above that. So if the applet can't get the colors done right, at least give us the option to tweak it our way, if possible. That isn't a dealbreaker though. The only letdown for me is the lack of disk temperature readouts, which is a shame. KDE can get that done out of the box and on Cinnamon, the Disks application shows that, so why can't Sensors do the same?
claudiux
claudiux-6 months ago
Hi @rflf4, The latest version of Sensors (2.0.0) is able to display disk temperatures.
rdlf4
rdlf4-4 months ago
Hi @claudiux That might not be the case anymore. No matter what I do, your applet is being really stubborn. In Temperature, scrolling down to Temperature Scripts, and upon clicking on 'renew the list of known disks', it displays two rows (sda and sdb), which is correct. But that's it. Disk temperatures never make it to the panel. 'Update display' does nothing. 'Show in panel' next to 'disk name' is checked. It's almost as if the applet is completely ignoring whatever is set under 'Temperature script'. Care to have a look? 2.0.1 here.
Swaphelaer
Swaphelaer-2 years ago
It doesn't show/find my CPU temp... The app said to disable : CPU Temperature Indicator (temperature@fevimu) which *did* show the CPU-temp. Could this be added so I have only 1 applet for all temps ? (GPU-temps would be an added benefit BTW :-) )
Swaphelaer
Swaphelaer-2 years ago
A reboot was needed to load the .conf Maybe you could add that to the FAQ ? So I do have a lot more to choose from although I still don't see the CPU/Cores. Might have to dive into this file (which should be correct for my MoBo) to see what else can be done. Still GPU (NVidia in my case) would be nice
Nik
Nik-2 years ago
Tried this app, but it gives me an odd warning: "This applet contains function calls that could potentially cause Cinnamon to Crash or freeze. If you are experiencing crashes or freezing, please try removing it." Still, I tried setting it up, and couldn't really get it working right. It's a bit too complicated and too many features for my taste. Personally, I like your CPU Temperature Indicator applet better. It's simpler, and that's the only number I'm looking for anyway. I like things that do 1 thing well. ;)
arehtykitna
arehtykitna-2 years ago
Works nicely on my Fujitsu LIFEBOOK-A512 with LMDE4. I was using the old fevimu applet and noticed your comment about no longer maintaining it so switched to this instead.
claudiux
claudiux-2 years ago
The version 1.4.0 of Sensors@claudiux is here! It is now fully compatible with Cinnamon 3.8, 4.0, 4.2, 4.4 and 4.6. Enjoy it!
Mark Wilber
Mark Wilber-2 years ago
Hi @claudiux. I have a Lenovo IdeaPad Y500, running Cinnamon 4.0.10, on top of Fedora 29 (yep), kernel 5.3.11-100. I have lmsensors and xsensors installed. Run from the command line 'sensors' works perfectly well, reporting temperatures for each of my 4 cores. Similarly, xsensors pops up a window with the same information. I've installed your cinnamon app, but it fails to load into the panel. When I select configuration and the 'General' tab, the buttons 'Example of sensor values from this computer' and 'Run xsensors' produce no output. When I press one of those buttons I get output like cinnamon[2542]: JS ERROR: Exception in method call: activateCallback: TypeError: obj is null CinnamonDBus.prototype.activateCallback@/usr/share/cinnamon/js/ui/cinnamonDBus.js:349:13 _handleMethodCall@resource:///org/cinnamon/cjs/modules/overrides/Gio.js:256:22 _wrapJSObject/<@resource:///org/cinnamon/cjs/modules/overrides/Gio.js:326:16 I don't know what to make of this. Any suggestions? Any required libraries that are not installed by default on a Fedora system?
claudiux
claudiux-2 years ago
Hi @mw0, I just installed Fedora 29 (!) on a very old machine (2007!). This applet works fine, except the direct links to setting-tabs that are in the menu (Temperature sensors, etc...). A new version is coming soon. I'm searching about any required library...
claudiux
claudiux-2 years ago
All works fine now, with version 1.4.0 of Sensors@claudiux.
claudiux
claudiux-2 years ago
Hi Mark, Can you open an issue, please? (See "How to report an issue or make a feature request?" above.) I will certainly have a lot of questions for you... Regards. Claudiux
claudiux
claudiux-2 years ago
Version 1.1.0 is here, with features requested by @pnsantos. Enjoy it!
Pedro Nuno Santos
Pedro Nuno Santos-2 years ago
Hey @claudiux thx for the quick turn around! However something seems to have gone wrong with the upload/publishing. The applet manager showed a new version available, but after I ran the update it was still 1.0.0 I tried removing and re-installing and now it's showing the icon saying "Something went wrong while loading Sensors@claudiux (...)" Also if I download it from the spices site I get a zip with 1.0.0 inside even though the page says: Last edited: 4 hours ago 2020-09-24, 09:07 Last commit: [bf2f3ea1] v1.1.0: Update README.md (#3232)
claudiux
claudiux-2 years ago
Hey Pedro, Try to download the zip with this link: https://cinnamon-spices.linuxmint.com/files/applets/Sensors@claudiux.zip?85ad0310-97d2-4ec0-a2bf-a968f7b2b0f0 or install this applet using Spices Update.
Pedro Nuno Santos
Pedro Nuno Santos-2 years ago
Thx, that worked perfectly! nice!
Pedro Nuno Santos
Pedro Nuno Santos-2 years ago
Hey Claudiux, First off, thanks for this applet, nice work! Been a long-time user of the previous CPU monitor and today I tried out this one towards replacing the former. Have a couple of nitpicks/suggestions if you are open to feedback: - The applet seems to have a border line around it (https://postimg.cc/vDjs5C3p) would it be possible to remove it or at least make it optional? - Do you think it's feasible to make the temperature icon be optional (have the ability to hide it). When showing the unit it's kinda obvious what the measurement is so the icon is sort of redundant (same applies to the icons on the tool tip, both the custom names and units make the icons redundant) Hope you don't mind the feedback - again thanks for all your work :-)
claudiux
claudiux-2 years ago
Hey Pedro, Thank you for your feedback. I will take into account your feature requests. Next version is coming soon. Regards. Claudiux