

README
NVIDIA Monitor Applet for Cinnamon
A friendly panel applet that keeps your NVIDIA GPU stats visible at a glance. It runs smoothly in both horizontal and vertical panels, and you can switch between text and graph (pie) styles — or mix them.
Features
The applet shows GPU temperature, memory usage, utilization, and fan speed. Each metric can be shown as text or a compact pie chart in the panel, and you can toggle any metric on or off. A separate monitor window provides a live graph with time axis, guide lines, and hover tooltips.

Usage
Click the applet to open its menu. From there you can open the monitor window or jump directly to either settings page. The applet also keeps a small history so the monitor graph fills instantly when you open it.

Requirements
- NVIDIA Drivers installed
nvidia-smicommand available in path
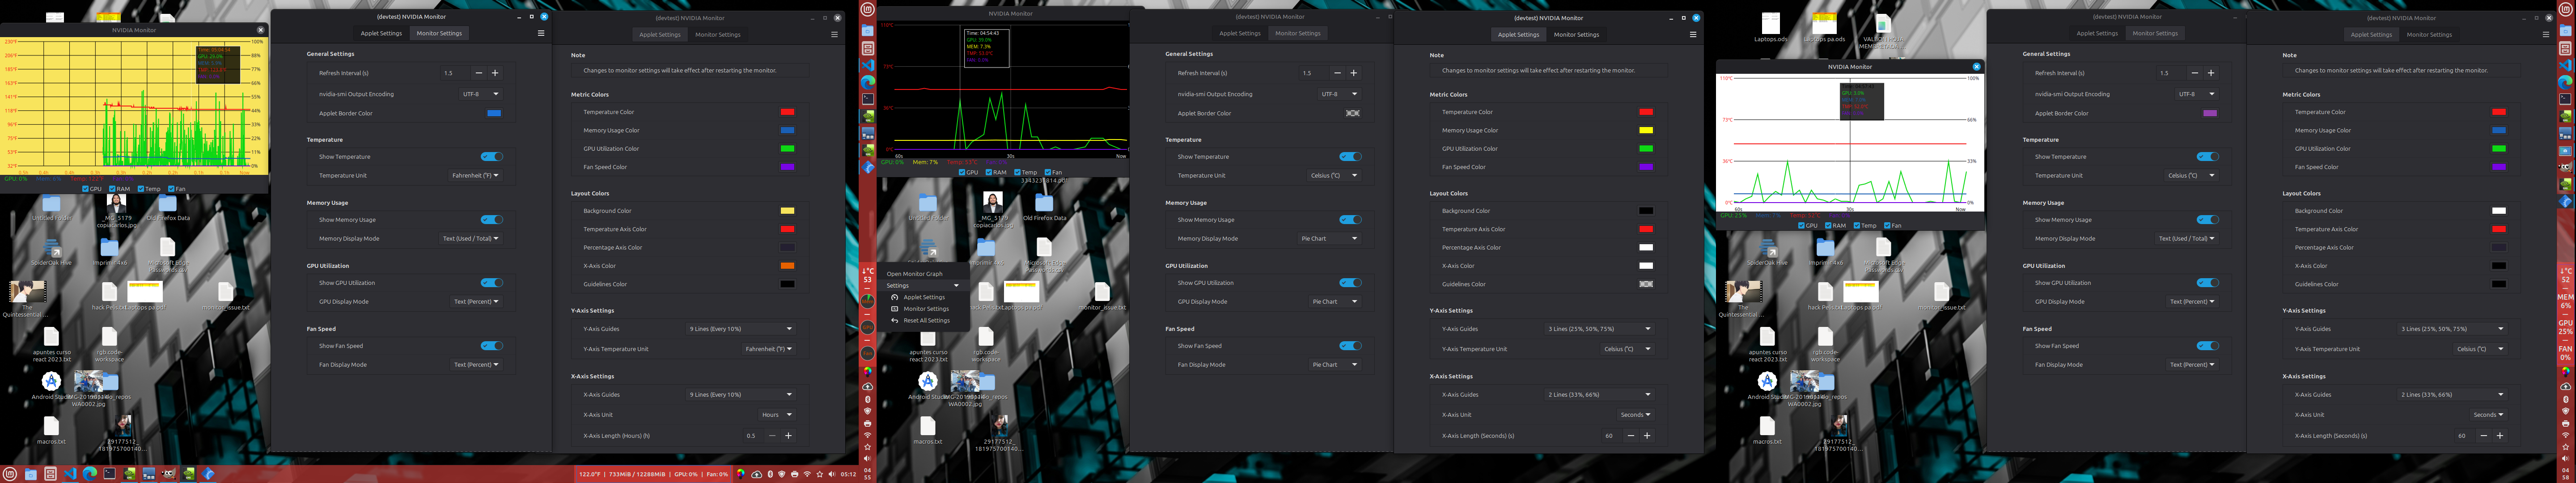
Applet display modes (text and graph, horizontal and vertical)
In the panel, each metric can be displayed as text or as a pie chart. Temperature is always shown as text, while Memory, GPU, and Fan can be text or pie. You can mix styles (for example, text temperature + pie GPU + text memory). If all metrics are disabled, a small placeholder label appears so the applet is still visible.
Horizontal panels show full inline text like “Used / Total MiB” for memory. Vertical panels switch to compact vertical labels and percentages so everything stays readable.
| Horizontal | ||
|---|---|---|
|
 |
| Vertical | ||
|---|---|---|
 |
 |
Context menu options
The menu includes: Open Monitor Graph, which launches the graph window; Applet Settings and Monitor Settings, which open each settings page; and Reset All Settings, which restores defaults.
Reset All Settings shows a confirmation dialog before applying the reset.

Settings and customization
Applet settings
These options control how the panel applet looks and updates:
| Setting | What it does |
|---|---|
| Refresh Interval | How often GPU stats are updated. Shorter intervals feel more live but use a little more CPU. |
| NVIDIA‑SMI Output Encoding | Selects the character encoding used for reading nvidia-smi output. Useful for non‑UTF‑8 locales. |
| Applet Border Color | Draws a border around the applet (set alpha to 0 to hide it). |
| Show Temperature | Toggles the temperature label in the panel. |
| Temperature Unit | Celsius or Fahrenheit for the panel temperature label. |
| Show Memory Usage | Toggles memory usage in the panel. |
| Memory Display Mode | Text (Used / Total) or Pie Chart for memory. |
| Show GPU Utilization | Toggles GPU utilization in the panel. |
| GPU Display Mode | Text (Percent) or Pie Chart for GPU usage. |
| Show Fan Speed | Toggles fan speed in the panel. |
| Fan Display Mode | Text (Percent) or Pie Chart for fan speed. |

Monitor settings
These options customize the separate monitor window. Changes take effect after restarting the monitor window (if it’s open, it will briefly restart to apply new settings).
| Setting | What it does |
|---|---|
| Temperature / Memory / GPU / Fan Colors | Line colors used by each metric in the graph and labels. |
| Background Color | The graph background color. |
| Temperature Axis Color | Color for the temperature axis labels. |
| Percentage Axis Color | Color for the % axis labels (GPU/Mem/Fan). |
| X‑Axis Color | Color for the time labels at the bottom. |
| Guidelines Color | Color of the grid/guide lines. |
| Y‑Axis Guides | Number of horizontal guide lines for the Y‑axis. |
| Y‑Axis Temperature Unit | Celsius or Fahrenheit for the temperature axis. |
| X‑Axis Guides | Number of vertical guide lines for the X‑axis. |
| X‑Axis Unit | Time unit for the X‑axis (Seconds, Minutes, Hours). |
| X‑Axis Length | How much history the graph displays (based on the selected unit). |

Monitor window
The monitor window opens next to the panel and its initial position adapts to the panel edge (top, bottom, left, or right). After it opens, it behaves like a normal independent window — you can move it wherever you want. If you open the monitor while it is already open, it is brought to the front. On multi‑desktop setups, if the monitor is on another workspace, you’ll need to switch to that workspace or move the window yourself.
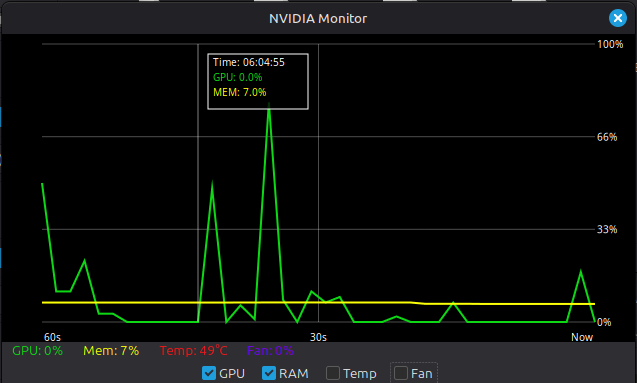
It shows a live time graph with dual Y‑axes (temperature and percent), customizable grid lines, and a time axis labeled from “Now” back to the selected history length. When you uncheck a metric, its line disappears and the corresponding axis labels are hidden (temperature axis for temperature, percentage axis for GPU/Mem/Fan).
Hover over the graph to see a tooltip with the exact time and values. You can also toggle any metric line on or off directly in the window using the checkboxes.

The applet keeps a running history while it’s active. The monitor graph displays the last X‑Axis Length window (seconds/minutes/hours), and the background history keeps growing until it reaches its limit, then the oldest chunk is purged in blocks (about 30 minutes at a time). To clear the history completely, reload the applet or restart Cinnamon.
Available languages
Catalan, Danish, German, Greek, Spanish, Finnish, French, Croatian, Hungarian, Icelandic, Italian, Japanese, Dutch, Portuguese, Romanian, Russian, Swedish, Turkish, Chinese (Simplified), Chinese (Traditional)
License
GPL‑3.0 (see LICENSE for the full text).
Log In To Comment!
2 Comments