
README
YASM — Yet Another System Monitor
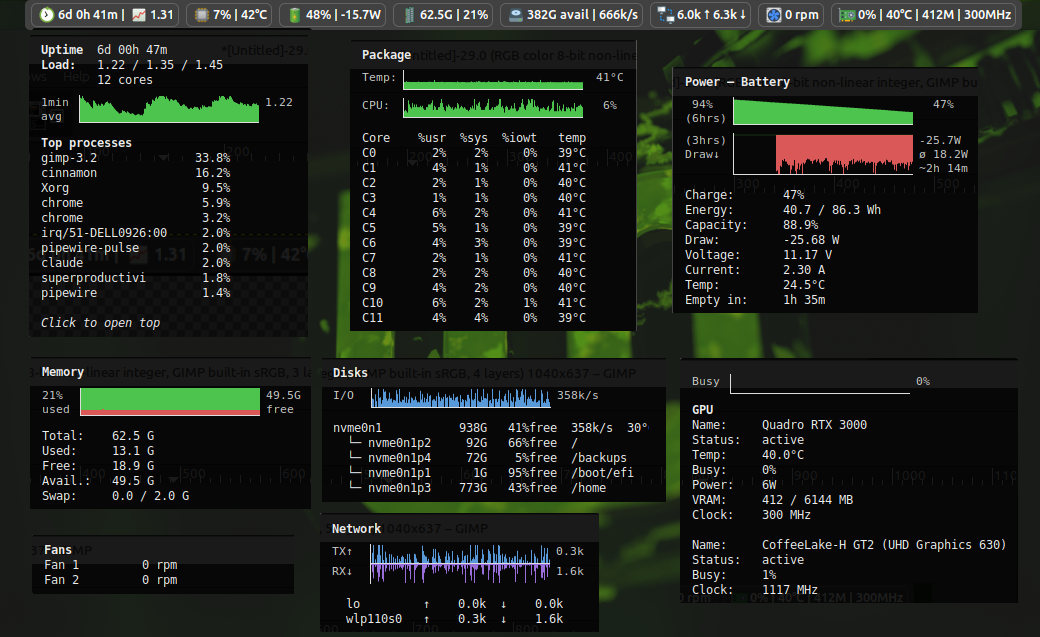
A compact Cinnamon panel applet that displays live system metrics with sparkline history graphs.
Metrics
- Uptime — system uptime + load average (click to open
top) - CPU — usage % + package temperature, with threshold colouring
- Battery — charge %, charge/discharge rate in watts, with AC/battery icon swap
- Memory — used % + total GB
- Disk — used % per mount + read/write throughput
- Network — TX/RX rates per interface
- Fan — RPM for detected fans
- GPU — utilisation %, temperature, VRAM, clock, power draw
Each tile shows a sparkline history graph on hover.
How it works
YASM reads system metrics directly from Linux virtual filesystems (/proc, /sys) on each polling cycle — no background daemon or service required. Virtual filesystem reads are effectively free: the kernel generates them on demand from in-memory data structures, so there is no disk I/O involved.
Data sources
| Metric | Source | Notes |
|---|---|---|
| CPU usage | /proc/stat |
Delta between two reads gives per-core usr/sys/iowait % |
| CPU temperature | /sys/class/hwmon/*/temp*_input |
Auto-discovers coretemp / k10temp / zenpower chips |
| CPU power | /sys/class/powercap/intel-rapl:0/energy_uj |
Intel RAPL; requires elevated permissions (see settings) |
| Memory | /proc/meminfo |
|
| Disk space | df (async subprocess) |
Runs at most once per 60 s |
| Disk I/O | /proc/diskstats |
Delta-based throughput calculation |
| Network | /proc/net/dev |
Delta-based TX/RX rate per interface |
| Battery | /sys/class/power_supply/*/ |
Charge %, voltage, current, status |
| Fan | /sys/class/hwmon/*/fan*_input |
Auto-discovers fan-capable hwmon chips |
| GPU | nvtop -s (preferred), nvidia-smi (fallback), or sysfs |
See GPU section below |
| Top processes | /proc/[pid]/stat |
Sampled every 5 s; sorted by CPU delta |
Why no daemon?
A monitoring daemon would add a persistent process, IPC overhead, and a service to manage — all unnecessary when the data sources are already zero-cost kernel interfaces. YASM runs entirely inside the Cinnamon applet lifecycle: it starts when the applet loads and stops when it's removed. No daemons, no sockets, no root privileges (except optional RAPL).
GPU metrics and nvtop
GPU utilisation cannot be read from sysfs alone on NVIDIA hardware (the kernel driver doesn't expose it). YASM uses nvtop -s (JSON snapshot mode) as the primary source — a single subprocess call that returns metrics for all GPUs at once: utilisation %, temperature, clock speed, power draw, and VRAM usage.
If nvtop is not installed, YASM falls back to:
- NVIDIA:
nvidia-smiquery (async subprocess) - AMD: sysfs (
gpu_busy_percent,mem_info_vram_*, hwmon temperature) - Intel: sysfs (
gt_cur_freq_mhz/gt_max_freq_mhz)
nvtop is preferred because it covers all vendor GPUs in one call, provides richer data than sysfs alone, and its -s flag was designed for exactly this kind of machine-readable snapshot.
Polling cycle
The refresh interval (default: 5 seconds, configurable 3–30 s in settings) drives the main loop. Not all metrics are read every tick — heavier or slower-changing data is rate-limited:
| Data | Read frequency |
|---|---|
| CPU, network, disk I/O | Every tick |
| GPU (nvtop / nvidia-smi) | Every tick (async) |
| Top processes | Every 5 s |
| Memory, fan, battery log | Every 15 s |
| Disk space (df) | Every 60 s |
This is not a real-time monitor. At the default 5 s interval, you get a useful trend view with minimal overhead. Setting the interval below 3 seconds is not supported — at that point the subprocess spawns (nvtop, df) and UI repaints start to become visible in the very metrics you're trying to measure.
Battery log
YASM writes a local battery log to ~/.local/share/yasm/battery-log.jsonl — one JSON line every 15 seconds recording timestamp, charge %, and power draw (watts). The log is automatically pruned to the last 6 hours on startup. This powers the battery sparkline tooltips that show charge/discharge trends over time.
No other data is written to disk.
Requirements
- Cinnamon 6.0+
nvtop(optional, for GPU metrics — provides the richest data across all GPU vendors)- Intel RAPL access (optional, for accurate CPU power on AC): run Enable RAPL from applet settings
Installation
Install via System Settings → Applets, or manually:
cp -r files/yasm@sniemetz ~/.local/share/cinnamon/applets/Then add YASM to your panel via right-click → Add applets to panel.
Log In To Comment!
8 Comments