System Monitor

UUID: sysmonitor@orcus
Last edited:
9 months ago 2023-06-06, 14:26
Last commit: [2f1093e4] added scaling functionality for network graph (#4869)

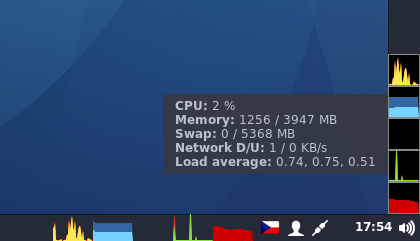
Displays CPU, memory, swap and network usage and load in graphs

README

Close

System monitor applet

This applet uses glibtop to get system resources usage statistics and displays them in graphs and also as text in tooltip.

All graph colors and sizes are configurable. Color settings support alpha channel, for ex. setting background alpha to 0 can make the background transparent.

Cinnamon settings API is used. All changes are applied on the fly and it is not necessary to restart the Cinnamon.

Installing glibtop

  • Ubuntu, Mint
    sudo apt-get install gir1.2-gtop-2.0
  • Fedora
    sudo dnf install libgtop2

CHANGELOG

Open

Log In To Comment!

32 Comments

Joan Spark
Joan Spark-4 weeks ago
I only use it to keep an eye on network activity on several desktop machines within the family (both wifi and eth) and its doing a good job .. all are LM 21.1 Cinnamon v5.6.8
Kevin Langman
Kevin Langman-1 month ago
Anyone else getting xsession-errors like this when "Network" is enabled? glibtop(c=9302): [WARNING] Failed to open "/sys/class/net/enp58s0u1u2/statistics/rx_packets": No such file or directory glibtop(c=9302): [WARNING] Failed to open "/sys/class/net/enp58s0u1u2/statistics/tx_packets": No such file or directory glibtop(c=9302): [WARNING] Failed to open "/sys/class/net/enp58s0u1u2/statistics/rx_bytes": No such file or directory glibtop(c=9302): [WARNING] Failed to open "/sys/class/net/enp58s0u1u2/statistics/tx_bytes": No such file or directory glibtop(c=9302): [WARNING] Failed to open "/sys/class/net/enp58s0u1u2/statistics/rx_errors": No such file or directory glibtop(c=9302): [WARNING] Failed to open "/sys/class/net/enp58s0u1u2/statistics/tx_errors": No such file or directory I believe this only started happening when I upgraded by router to one with Wifi-6e, but I can't be sure.
Dalton Messmer
Dalton Messmer-1 year ago
On my Linux Mint 20.3, the tooltips aren't appearing when I hover over the graphs.
Ranie Santos
Ranie Santos-1 year ago
This was regularly causing my entire system to freeze for some reason. It took me a long time to figure out what was potentially causing it. Some days have passed and the issue seems to have stopped ever since I uninstalled it.
Zhumatiy Sergey
Zhumatiy Sergey-1 year ago
Don't work on my ubuntu 22.04, gir1.2-gtop-2.0 is installed, but applet says it is not. How can I debug it?
richo
richo-2 years ago
thanks
Jens Glathe
Jens Glathe-2 years ago
Hi there, just wanted to say I use it as default system monitor in the task bar. Great tool, thank you for developing it.
dhdurgee
dhdurgee-2 years ago
Now that I have been using your applet a little longer I have some additional suggestions. It would be nice to add horizontal grid lines to the CPU chart dividing it into as many horizontal segments as there are CPU cores. It might also make sense to add horizontal grid lines delineating GB in the memory chart. Feel free to make this optional with a switch in the configuration.
dhdurgee
dhdurgee-2 years ago
I have just installed you applet and have some suggestions. If possible I would like to see an option to integrate your current memory and swap graphs into a single graph with free memory represented in the graph as well. Beyond that I would also find it useful to have a graph for disk activity. Thank you for your applet.
idlerwheel
idlerwheel-3 years ago
I'm confused. I'm really confused. I just installed this in my Mint 19.1. The app is showing me little squiggly graphoids in the panel in different colors. What do these things all mean? Which graphs are which? Color significance? I'm completely in the dark. I don't see any doc or help anywhere.. Is there any documentation? Where can I find it. I could sure use it. Am I a dunderbrain who just hasn't caught the vibe? Help!
M. MAD
M. MAD-3 years ago
Just hover your mouse over it, wait a little bit, a tooltip shows up, giving you more information, Note that you can also change colors by selecting "Configure..." from right click menu which apears after right-clicking the graphs
exposight
exposight-3 years ago
After Mint upgrade to 20.1 which comes with Cinnamon 4.8 (based on MozJS78) the applet no longer start, and makes Cinnamon crash in case of system start when it's enabled. Not sure it's an issue with applet or with Cinnamon, but I'm unable to use it. Tried updating, removing, resetting its settings and Cinnamon settings - no luck.
exposight
exposight-3 years ago
Updating Cinnamon CJS package solved the issue! Updated, rebooted, removed and added back the applet - now it works fine. See also https://github.com/linuxmint/cinnamon-spices-applets/issues/3416
Alex Shostak
Alex Shostak-3 years ago
Thank you. This helped for me.
ymihere
ymihere-3 years ago
Alright, there is the Multi-Core System Monitor as downloadable applet, but I liked the good old colored system monitor better.
ymihere
ymihere-3 years ago
same. anybody got a fix or alternative?
Alex Shostak
Alex Shostak-3 years ago
Same here.
Alain Pannetier
Alain Pannetier-3 years ago
Seems newer version doesn't show call out when hovering pointer above applet. Am I missing something?
quoccuongmmt
quoccuongmmt-3 years ago
Nice applet
Ducvoccer
Ducvoccer-3 years ago
Not work in linux mint 20. Can you fix it?
Manish Sinha
Manish Sinha-3 years ago
Thanks for this applet. Just a FYI in case it helps others - I did need to restart Cinnamon in order to get the applet to work.
theEligos
theEligos-3 years ago
Nice applet, could have text over graphs displaying current values.
beisso
beisso-3 years ago
Hello guys. Im newbie in linux, just learning. I've installed the package as the instructions above, and i got this result. It returned a success installation, right? Why can't I find it on my start menu?: Reading package lists... Done Building dependency tree Reading state information... Done gir1.2-gtop-2.0 is already the newest version (2.38.0-2ubuntu0.18.04.1). The following package was automatically installed and is no longer required: libcpufreq0 Use 'sudo apt autoremove' to remove it. 0 upgraded, 0 newly installed, 0 to remove and 78 not upgraded.
Terlekchi Seityagiya
Thanks for the applet. Please add the ability to monitor the temperature of CPU and SSD.
Nitrooo
Nitrooo-4 years ago
This. And also would be nice to display text on the graphs with the current values. For example: current network downloaded/uploaded data.
Nitrooo
Nitrooo-4 years ago
Nice applet, but it sadly lacks a disk I/O monitor. Too bad.
1908926
1908926-4 years ago
What a wonderful utility to allow monitoring my computer at the blink of an eye. 'Tom Cloyd MS MA' was correct in his comment, and I can't say it any better. "After using this for a number of days, I can report complete satisfaction. I wanted to know about CPU load, RAM usage, and swap usage, most particularly - in real time, without having to open a window to find this information. This application gives me all this and more in a single quick glance, with detailed specifics if I mouseover. Well done!" I agree with his comment, 100%.
rn2208
rn2208-4 years ago
It's spot-on, thank you.
Tom Cloyd MS MA
Tom Cloyd MS MA-5 years ago
After using this for a number of days, I can report complete satisfaction. I wanted to know about CPU load, RAM usage, and swap usage, most particularly - in real time, without having to open a window to find this information. This application gives me all this and more in a single quick glance, with detailed specifics if I mouseover. Well done!
Eugene
Eugene-5 years ago
Please add Disk I/O
PizzaDude
PizzaDude-5 years ago
best system monitor
lex
lex-6 years ago
unfortunately this applet have memory leaks, 4 gb in 3 days for cinnamon process